User Journey Monitoring Monitor your customer journeys’ performance
Our website speed test and monitoring service allows you to replicate any user navigation scenario, no matter how complex it may be.
By monitoring your most strategic user journeys, make sure you detect every single slowdown or failure thanks to our customizable checkpoints and alerts.
Edit your monitored user journeys at any given time, whatever the technologies your website is operating under and without any installation. Definitively a valuable agility boost compared to the other tools available on the market!

Discover our transaction monitoring service for free

Monitor your scenarios - even the most complex ones
The Dareboost transaction monitoring service is adapted to all types of businesses and websites: e-commerce, news website, any kind of back- or front-office activities.
Replicate your most strategic user journeys: conversion funnel, form completion and submission or simple browsing through a series of web pages.
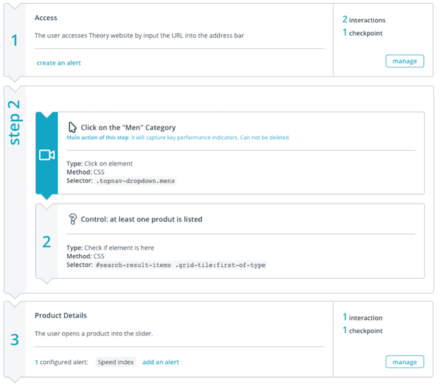
Dareboost also allows you to set up your own checkpoints, to be tested at each scenario execution. Without a single effort, make sure your user journey is always functional and identify the slightest defect before it taints your user’s experience!
User journeys, steps & alerts
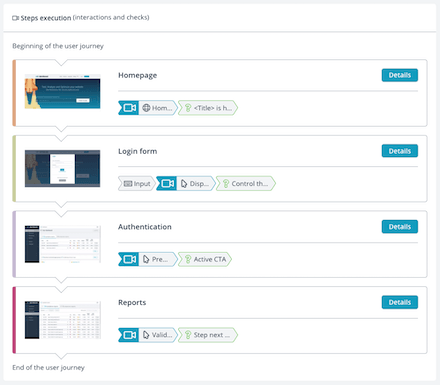
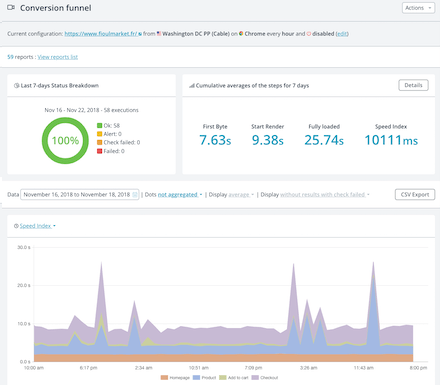
The Dareboost dashboard gives you access to your scenario monitoring data divided into 4 levels of interpretation, ranging from overall data history of the entire user journey to detailed information about the execution of a single step.
The metrics regarding speed may be reviewed on every single one of these levels, as well as the number of requests and weight breakdown (image, JavaScript, etc.).
You may configure your own performance budget for the whole journey as well as for a specific step. You will then receive customized alerts according to your own issues.

Video playback, UX and technical indicators
For every execution of your user journeys, you can play back the video and get a filmstrip view for an image by image focus. We also provide a whole range of metrics related to user experience (UX), such as Start Render, Visually Complete and Speed Index. The perfect counterpart to all the available technical indicators (browser console, timeline, etc.).
Export and API triggering
In the event that our custom dashboards and weekly reports do not fulfill your needs, you can still export your monitoring data in a CSV file in a single click.
Our API also grants you access to your data, to be used with your own tools, as well as the possibility of automating your user journey execution, a feature that may be triggered by new deployments for example.
Join our 450+ Pro customers and start optimizing your website now
